Linux Block Layer: Tools, Tracing, and Documentation
Linux Block Layer: Tools, Tracing, and Documentation
This post collects various useful docs and tools related to the Linux block layer.
Linux Storage Stack Diagram
See for example Linux-storage-stack-diagram_v6.18.png:

Online documentation
Kernel docs:
Various docs:
- Linux Device Drivers, Third Edition, book chapter 16 (2005)
- Explicit block device plugging (LWN, 2011)
- The multiqueue block layer (LWN, 2013)
- Linux Block IO: Introducing Multi-queue SSD Access on Multi-core Systems (pdf) (2013)
- Solving the Linux storage scalability bottlenecks (Jens Axboe, Facebook, Kernel Recipes 2015)
- Linux kernel IO subsystem: How it works and how can I see what is it doing? (Jan Kara, SUSE, Kernel Recipes 2015)
- Two new block I/O schedulers for 4.12 (LWN, 2017)
- Block layer introduction part 1: the bio layer (LWN, 2017)
- Block layer introduction part 2: the request layer (LWN, 2017)
- The Linux Block Layer - Built for Fast Storage (2018)
- Faster IO through io_uring (Jens Axboe, Facebook, Kernel Recipes 2019)
- Efficient IO with io_uring (pdf) (2019)
- The rapid growth of io_uring (LWN, 2020)
- Linux block devices: hints for debugging and new developments (Christian Horn, Red Hat Blog, Sept 2021)
Legacy non-multiqueue block layer
The legacy (non-multiqueue) block layer code has been removed, now that
no drivers require it. The legacy I/O schedulers (including CFQ and
deadline) have been removed as well.
Block layer statistics
Block layer statistics are provided in /proc and /sys:
/proc/diskstats/sys/block/<dev>/stat
Example:
$ cat /proc/diskstats
 253       0 vda 270 0 12784 37 0 0 0 0 0 39 1 0 0 0 0
 253      16 vdb 11260 36 413935 14432 226458 30087 234475314 12913000 0 535716 12839675 0 0 0 0
 253      17 vdb1 11217 36 411551 14405 225987 30087 234475314 12907531 0 530602 12834424 0 0 0 0
  11       0 sr0 49 0 356 27 0 0 0 0 0 35 1 0 0 0 0
Both files provide the same statistics, see kernel documentation for details:
- Documentation/ABI/testing/procfs-diskstats
- Documentation/ABI/testing/sysfs-block
I/O statistics fieldsBlock layer statistics in /sys/block/<dev>/stat
Helpful /proc/diskstats one-liners
I) Shell one-liner to read /proc/diskstats with column names added:
(printf "maj min dev r_ios r_merges r_sect r_msecs w_ios w_merges w_sect w_msecs in_flight io_ticks time_in_q d_ios d_merges d_sect d_msecs flush_ios flush_msecs\n" ; cat /proc/diskstats) | column -t

maj  min  dev    r_ios    r_merges  r_sect    r_msecs  w_ios    w_merges  w_sect    w_msecs     in_flight  io_ticks  time_in_q   d_ios  d_merges  d_sect  d_msecs  flush_ios  flush_msecs
8    0    sda    1992973  664069    62644139  523308   1292694  1718988   82901491  1010300     0          968251    852782      0      0         0       0        193748     231495
8    1    sda1   552      162       11044     295      10       0         11        3           0          111       98          0      0         0       0        0          0
8    2    sda2   138      125       10746     141      7        1         64        5           0          85        100         0      0         0       0        0          0
8    3    sda3   1991549  663782    62617692  521614   1189392  1718987   82901416  883765      0          953282    751889      0      0         0       0        0          0
253  0    dm-0   2666505  0         62614964  1273835  3011721  0         82901416  1023386852  0          977685    1024660687  0      0         0       0        0          0
253  1    dm-1   384375   0         15134698  486437   189052   0         3256312   806227      0          120895    1292664     0      0         0       0        0          0
253  2    dm-2   475772   0         3810080   135730   1338837  0         10710696  997255131   0          54529     997390861   0      0         0       0        0          0
253  3    dm-3   1806307  0         43667794  656210   1483832  0         69658504  25335845    0          827170    25992055    0      0         0       0        0          0
7    0    loop0  154      0         2340      27       0        0         0         0           0          42        7           0      0         0       0        0          0
7    1    loop1  241      0         2482      120      0        0         0         0           0          58        55          0      0         0       0        0          0
7    2    loop2  90       0         2180      35       0        0         0         0           0          29        19          0      0         0       0        0          0
7    3    loop3  102      0         2210      23       0        0         0         0           0          28        8           0      0         0       0        0          0
7    4    loop4  230      0         1058      19       0        0         0         0           0          51        0           0      0         0       0        0          0
7    5    loop5  4        0         8         0        0        0         0         0           0          2         0           0      0         0       0        0          0
II) Same, output once per second:
while true ; do (printf "maj min dev r_ios r_merges r_sect r_msecs w_ios w_merges w_sect w_msecs in_flight io_ticks time_in_q d_ios d_merges d_sect d_msecs flush_ios flush_msecs\n" ; cat /proc/diskstats) | column -t ; echo ; sleep 1 ; done
III) Alternate output, per device/partition (note sda in the grep command):
$ paste <(printf "major\nminor\ndev\nread_ios\nread_merges\nread_sectors\nread_msecs\nwrite_ios\nwrite_merges\nwrite_sectors\nwrite_msecs\nin_flight\nio_ticks\ntime_in_queue\ndiscard_ios\ndiscard_merges\ndiscard_sectors\ndiscard_msecs\nflush_ios\nflush_msecs\n") <(grep -w sda /proc/diskstats | tr ' ' '\n' | grep -v '^$') | column -t

major            8
minor            0
dev              sda
read_ios         1992982
read_merges      664072
read_sectors     62644811
read_msecs       523311
write_ios        1299073
write_merges     1721300
write_sectors    83019803
write_msecs      1012075
in_flight        0
io_ticks         970009
time_in_queue    853486
discard_ios      0
discard_merges   0
discard_sectors  0
discard_msecs    0
flush_ios        194457
flush_msecs      232257
sar, iostat
sysstat package contains commonly used admin tools sar and iostat for
monitoring disk I/O. Under the hood, the tools are are based on
/proc/diskstats.
Running sar -d (use sar -dp for pretty-printed device names) shows
historical summary based on data collected background
(sysstat-collect.timer):
$ sar -d
Linux 5.5.10-100.fc30.x86_64        03/26/20        _x86_64_        (8 CPU)

07:27:26          DEV       tps     rkB/s     wkB/s   areq-sz    aqu-sz     await     svctm     %util
07:30:00       dev8-0    685.12   6300.30   4828.89     16.24      0.12      0.35      0.20     13.53
07:30:00     dev253-0   1160.66   6297.58   4828.89      9.59      1.92      1.65      0.12     13.60
...
14:20:14          DEV       tps     rkB/s     wkB/s   areq-sz    aqu-sz     await     svctm     %util
14:30:00       dev8-0     19.34      0.78    179.53      9.32      0.00      0.27      0.27      0.51
14:30:00     dev253-0     25.61      0.78    179.53      7.04      0.01      0.53      0.21      0.53
15:20:14       dev8-0     18.77      0.43    196.49     10.49      0.00      0.29      0.27      0.51
15:20:14     dev253-0     25.80      0.43    196.49      7.63      0.02      0.62      0.20      0.52
Average:       dev8-0     77.77    776.89    575.50     17.39      0.01      0.34      0.28      2.15
Average:     dev253-0    151.34    776.87    575.50      8.94     35.24    232.86      0.14      2.17
Use sar -dp <interval> [<count>] to run it and report current values.
iostat can show some more I/O information, try for example: iostat -xz 1
See the manual pages for documentation of the outputs: sar, iostat
diskstats script
Grab my diskstats perl script.
$ ./diskstats

18:25:31    Dirty: 6532 kB    Writeback: 0 kB    WritebackTmp: 0 kB
  maj   min        dev r_ios  r_merges  r_sect  r_msecs w_ios  w_merges  w_sect  w_msecs  in_flight  io_ticks  time_in_q d_ios  d_merges  d_sect  d_msecs f_ios  f_msecs
  252     0       dm-0    +1         -      +8       +7   +44         -    +352       +1          0        +8         +8     -         -       -        -     -        -
  252     1       dm-1    +1         -      +8       +7   +44         -    +352       +1          0        +8         +8     -         -       -        -     -        -
  252     2       dm-2     -         -       -        -     -         -       -        -          0         -          -     -         -       -        -     -        -
  259     0    nvme0n1    +1         -      +8       +7   +13       +31    +352       +1          0        +8         +7     -         -       -        -    +1        -
  259     1  nvme0n1p1     -         -       -        -     -         -       -        -          0         -          -     -         -       -        -     -        -
  259     2  nvme0n1p2     -         -       -        -     -         -       -        -          0         -          -     -         -       -        -     -        -
  259     3  nvme0n1p3    +1         -      +8       +6   +13       +31    +352       +1          0        +8         +7     -         -       -        -     -        -
  251     0      zram0    +6         -     +48        -     -         -       -        -          0         -          -     -         -       -        -     -        -

18:25:32    Dirty: 1768 kB    Writeback: 0 kB    WritebackTmp: 0 kB
  maj   min        dev r_ios  r_merges  r_sect  r_msecs w_ios  w_merges  w_sect  w_msecs  in_flight  io_ticks  time_in_q d_ios  d_merges  d_sect  d_msecs f_ios  f_msecs
  252     0       dm-0     -         -       -        -  +108         -   +9808     +382          0       +18       +382     -         -       -        -     -        -
  252     1       dm-1     -         -       -        -   +90         -   +9808     +308          0       +18       +308     -         -       -        -     -        -
  252     2       dm-2     -         -       -        -     -         -       -        -          0         -          -     -         -       -        -     -        -
  259     0    nvme0n1     -         -       -        -   +95       +13   +9808     +268          0       +17       +271     -         -       -        -    +4       +3
  259     1  nvme0n1p1     -         -       -        -     -         -       -        -          0         -          -     -         -       -        -     -        -
  259     2  nvme0n1p2     -         -       -        -     -         -       -        -          0         -          -     -         -       -        -     -        -
  259     3  nvme0n1p3     -         -       -        -   +95       +13   +9808     +268          0       +18       +268     -         -       -        -     -        -
  251     0      zram0    +8         -     +64        -     -         -       -        -          0      +177          -     -         -       -        -     -        -

[...]
/proc/meminfo
/proc/meminfo has some fields particularly relevant to I/O, and are included
in the diskstats script output above:
| Entry | Description |
|---|---|
| Dirty | Memory which is waiting to get written back to the disk. |
| Writeback | Memory which is actively being written back to the disk. |
| WritebackTmp | Memory used by FUSE for temporary writeback buffers. |
Check kernel docs: Documentation/filesystems/proc.txt
QEMU I/O Throttling for VMs
QEMU allows I/O throttling per drive. The throttling settings can be defined in the qemu command line, and on-fly via qemu monitor interface. See QEMU docs/throttle.txt for full details.
The QEMU monitor command for throttling has following syntax:
block_set_io_throttle device bps bps_rd bps_wr iops iops_rd iops_wr
The command always requires value for all the parameters, zero can be used for default (“unlimited”) value.
Example, allow one I/O operation per second (iops) on the root drive:
block_set_io_throttle drive-root 0 0 0 1 0 0
Example, allow 4096 bytes per second (bps) on the root drive:
block_set_io_throttle drive-root 4096 0 0 0 0 0
Set all values to zero to reset:
block_set_io_throttle drive-root 0 0 0 0 0 0
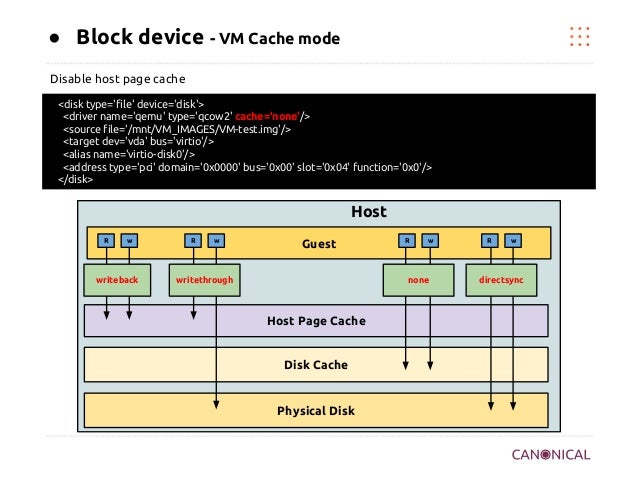
QEMU Disk Cache Modes
QEMU has a few disk cache modes, and ways to do I/O (image source, slide
27),
default is writeback:
Links:
- SUSE SLES “Virtualization Guide” chapter Disk Cache Modes.
- devconf.cz 2016 info: QEMU Disk IO Which performs Better: Native or threads?
- devconf.cz 2016 slides: QEMU Disk IO Which performs Better: Native or threads?
- Red Hat Performance Briefs PDF (2016): Qemu Disk I/O: Which performs better, Native or Threads?
Chapter 8 and 9 from that Red Hat PDF:
8 Limitations of Native AIO

  The Linux AIO io_submit(2) system call is used to implement aio=native. This
  system call attempts to submit I/O requests asynchronously but there are cases
  where it may block.  Avoiding these cases is important so that the VM does not
  experience pauses.

  Linux file systems may block in order to acquire thread synchronization
  primitives or wait for internal data structures or metadata. In these cases the
  thread is blocked in the io_submit(2) system call.

  Writes to sparsely allocated files are more likely to block than fully
  preallocated files.  Therefore it is recommended to only use aio=native on
  fully preallocated files, local disks, or logical volumes.

9 Conclusion

  As IO performance is significantly improved with aio=native, io=native is
  recommended choice though there are few challenges especially with single VM in
  some of the combinations and continue to investigate to improve further. Native
  AIO can block the VM if the file is not fully allocated and is therefore not
  recommended for use on sparse files.

  We will continue reporting performance tests such as this, showing actual achievable
  performance of KVM IO. We have a lot more to share.
cache=writeback
Host qemu trace, default cache=writeback:
# perf trace -p $(pgrep -n qemu) -e pwritev
     0.000 ( 0.102 ms): worker/26156 pwritev(fd: 20, vec: 0x5626a1a1ebe0, vlen: 3, pos_l: 5287936)         = 12288
   308.627 ( 0.094 ms): worker/26162 pwritev(fd: 20, vec: 0x5626a1cbd000, vlen: 16, pos_l: 8872460288)     = 65536
   308.925 ( 0.752 ms): worker/26160 pwritev(fd: 20, vec: 0x5626a1cbd000, vlen: 191, pos_l: 16854286336)   = 786432
   309.907 ( 0.097 ms): worker/26161 pwritev(fd: 20, vec: 0x5626a1cbd000, vlen: 10, pos_l: 6676086784)     = 65536
   310.218 ( 0.134 ms): worker/26155 pwritev(fd: 20, vec: 0x5626a1cbd000, vlen: 16, pos_l: 16855072768)    = 131072
   311.454 ( 0.243 ms): worker/26156 pwritev(fd: 20, vec: 0x5626a1cbd000, vlen: 64, pos_l: 16855203840)    = 262144
cache=writethrough
Host qemu trace cache=writethrough:
# perf trace -p $(pgrep -n qemu) -e "*sync*,*pwrite*"
     0.725 ( 0.481 ms): qemu-system-x8/465527 pwritev(fd: 14, vec: 0x5591901b9e80, vlen: 237, pos_l: 59701198848)   = 1048576
     1.310 (11.907 ms): qemu-system-x8/465541 fdatasync(fd: 14)                                                     = 0
    13.887 ( 0.481 ms): qemu-system-x8/465546 pwritev(fd: 14, vec: 0x5591902d4940, vlen: 237, pos_l: 59702247424)   = 1048576
    14.480 (11.571 ms): qemu-system-x8/465543 fdatasync(fd: 14)                                                     = 0
    26.759 ( 0.485 ms): qemu-system-x8/465529 pwritev(fd: 14, vec: 0x5591901b9e80, vlen: 237, pos_l: 59703296000)   = 1048576
    27.386 (11.946 ms): qemu-system-x8/465526 fdatasync(fd: 14)                                                     = 0
cache=none
Host qemu trace cache=none (file descriptor is O_DIRECT):
# perf trace -p $(pgrep -n qemu) -e pwritev*
     0.000 ( 5.073 ms): qemu-system-x8/7494 pwritev(fd: 20, vec: 0x557dfae7b1e0, vlen: 250, pos_l: 3824418816)    = 1048576
     6.363 ( 4.702 ms): qemu-system-x8/7494 pwritev(fd: 20, vec: 0x557dfae7b1e0, vlen: 250, pos_l: 3825467392)    = 1048576
    12.325 ( 5.218 ms): qemu-system-x8/7494 pwritev(fd: 20, vec: 0x557dfae7b1e0, vlen: 250, pos_l: 3826515968)    = 1048576
    18.784 ( 4.933 ms): qemu-system-x8/7494 pwritev(fd: 20, vec: 0x557dfae7b1e0, vlen: 250, pos_l: 3827564544)    = 1048576
    25.010 ( 4.606 ms): qemu-system-x8/7494 pwritev(fd: 20, vec: 0x557dfae7b1e0, vlen: 250, pos_l: 3828613120)    = 1048576
aio=native
Host qemu trace aio=native,cache=none:
# perf trace -p $(pgrep -n qemu) -e io_submit,ppoll
  6572.049 ( 0.151 ms): qemu-system-x8/466669 io_submit(ctx_id: 140385133363200, nr: 1, iocbpp: 0x7fff5bb25310)     = 1
  6572.219 ( 1.821 ms): qemu-system-x8/466669 ppoll(ufds: 0x55efc933f520, nfds: 16, tsp: 0x7fff5bb25960, sigsetsize: 8) = 1
  6574.101 ( 0.494 ms): qemu-system-x8/466669 ppoll(ufds: 0x55efc933f520, nfds: 16, tsp: 0x7fff5bb25960, sigsetsize: 8) = 1
  6574.686 ( 0.148 ms): qemu-system-x8/466669 io_submit(ctx_id: 140385133363200, nr: 1, iocbpp: 0x7fff5bb25310)     = 1
  6574.854 ( 7.801 ms): qemu-system-x8/466669 ppoll(ufds: 0x55efc933f520, nfds: 16, tsp: 0x7fff5bb25960, sigsetsize: 8) = 1

$ strace -T -tt -f -y -p $(pgrep -n qemu) -e trace=io_submit,ppoll -s 1
strace: Process 466669 attached with 48 threads

[pid 466669] 09:19:19.400185 io_submit(0x7fadf6018000, 1, [{aio_data=0, aio_lio_opcode=IOCB_CMD_PWRITEV, aio_fildes=14<rcpqemu-20004.qcow2>, aio_buf=[{iov_base="\0"..., iov_len=4096}, ...], aio_offset=17919311872, aio_flags=IOCB_FLAG_RESFD, aio_resfd=15<anon_inode:[eventfd]>}]) = 1 <0.000159>
[pid 466669] 09:19:19.400466 ppoll([{fd=75<socket:[11583759]>, events=POLLIN|POLLPRI|POLLERR|POLLHUP}, ...], 16, {tv_sec=0, tv_nsec=499000000}, NULL, 8) = 1 ([{fd=15, revents=POLLIN}], left {tv_sec=0, tv_nsec=497942766}) <0.001124>
[pid 466669] 09:19:19.401863 ppoll([{fd=75<socket:[11583759]>, events=POLLIN|POLLPRI|POLLERR|POLLHUP}, ...], 16, {tv_sec=0, tv_nsec=499000000}, NULL, 8) = 1 ([{fd=68, revents=POLLIN}], left {tv_sec=0, tv_nsec=498707689}) <0.000314>
[pid 466669] 09:19:19.402399 io_submit(0x7fadf6018000, 1, [{aio_data=0, aio_lio_opcode=IOCB_CMD_PWRITEV, aio_fildes=14<rcpqemu-20004.qcow2>, aio_buf=[{iov_base="\0"..., iov_len=4096}, ...], aio_offset=17920098304, aio_flags=IOCB_FLAG_RESFD, aio_resfd=15<anon_inode:[eventfd]>}]) = 1 <0.000176>
[pid 466669] 09:19:19.402673 ppoll([{fd=75<socket:[11583759]>, events=POLLIN|POLLPRI|POLLERR|POLLHUP}, ...], 16, {tv_sec=0, tv_nsec=499000000}, NULL, 8) = 1 ([{fd=15, revents=POLLIN}], left {tv_sec=0, tv_nsec=497864381}) <0.001203>
[pid 466669] 09:19:19.404140 ppoll([{fd=75<socket:[11583759]>, events=POLLIN|POLLPRI|POLLERR|POLLHUP}, ...], 16, {tv_sec=0, tv_nsec=499000000}, NULL, 8) = 1 ([{fd=68, revents=POLLIN}], left {tv_sec=0, tv_nsec=498677674}) <0.000344>
[pid 466669] 09:19:19.404716 io_submit(0x7fadf6018000, 1, [{aio_data=0, aio_lio_opcode=IOCB_CMD_PWRITEV, aio_fildes=14<rcpqemu-20004.qcow2>, aio_buf=[{iov_base="\0"..., iov_len=4096}, ...], aio_offset=17921146880, aio_flags=IOCB_FLAG_RESFD, aio_resfd=15<anon_inode:[eventfd]>}]) = 1 <0.000180>
BCC
BCC provides some tools for tracing and summarizing block I/O. Can be run in host and guest.
| Tool | Description |
|---|---|
| biolatency | Summarize block device I/O latency as a histogram. |
| biosnoop | Trace block I/O. |
| biotop | Block device (disk) I/O by process. |
| biopattern | Identify random/sequential disk access patterns. |
biolatency, per disk -D:
# /usr/share/bcc/tools/biolatency -T -Q -m -D 1 5
Tracing block device I/O... Hit Ctrl-C to end.

14:30:29

disk = b'sda'
     msecs               : count     distribution
         0 -> 1          : 1        |****************************************|
         2 -> 3          : 1        |****************************************|
         4 -> 7          : 0        |                                        |
         8 -> 15         : 1        |****************************************|

14:30:30

disk = b'sda'
     msecs               : count     distribution
         0 -> 1          : 321      |****************************************|
         2 -> 3          : 64       |*******                                 |
         4 -> 7          : 91       |***********                             |
         8 -> 15         : 72       |********                                |
        16 -> 31         : 14       |*                                       |

[...]
biolatency, per I/O flags -F:
# /usr/share/bcc/tools/biolatency -T -Q -m -F 1 5
Tracing block device I/O... Hit Ctrl-C to end.

14:31:53

flags = NoMerge-Write
     msecs               : count     distribution
         0 -> 1          : 11       |**********                              |
         2 -> 3          : 20       |*******************                     |
         4 -> 7          : 35       |**********************************      |
         8 -> 15         : 41       |****************************************|
        16 -> 31         : 1        |                                        |

flags = Write
     msecs               : count     distribution
         0 -> 1          : 346      |****************************************|
         2 -> 3          : 12       |*                                       |
         4 -> 7          : 43       |****                                    |
         8 -> 15         : 18       |**                                      |

flags = Sync-Write
     msecs               : count     distribution
         0 -> 1          : 130      |****************************************|
         2 -> 3          : 0        |                                        |
         4 -> 7          : 20       |******                                  |

[...]
biosnoop
# /usr/share/bcc/tools/biosnoop -Q
TIME(s)     COMM           PID    DISK    T SECTOR     BYTES  QUE(ms) LAT(ms)
0.000000    dmcrypt_write/ 763    sda     W 445934576  12288     0.01    0.09
0.000080    dmcrypt_write/ 763    sda     W 445934600  20480     0.00    0.14
0.000106    dmcrypt_write/ 763    sda     W 445934640  8192      0.00    0.16
0.000212    dmcrypt_write/ 763    sda     W 445934656  12288     0.01    0.07
0.001622    dmcrypt_write/ 763    sda     W 445934680  4096      0.02    0.08
4.084633    dmcrypt_write/ 763    sda     W 490876152  4096      0.01    0.04
[...]
biotop
# /usr/share/bcc/tools/biotop -C 1 5
Tracing... Output every 1 secs. Hit Ctrl-C to end

17:29:06 loadavg: 0.61 0.69 0.70 2/924 297038

PID    COMM             D MAJ MIN DISK       I/O  Kbytes  AVGms
297031 find             R 8   0   sda        131   536.0   6.95
286044 kworker/0:2      W 8   0   sda          8   256.0   7.95
1835   jbd2/sda2-8      W 8   0   sda          2    20.0  12.51

17:29:07 loadavg: 0.61 0.69 0.70 2/924 297038

PID    COMM             D MAJ MIN DISK       I/O  Kbytes  AVGms
297031 find             R 8   0   sda        244   976.0   3.88
295394 kworker/1:4      W 8   0   sda         16   512.0  14.05
286044 kworker/0:2      W 8   0   sda         16   512.0  11.88

17:29:08 loadavg: 0.61 0.69 0.70 2/924 297038

PID    COMM             D MAJ MIN DISK       I/O  Kbytes  AVGms
297031 find             R 8   0   sda        216   880.0   4.31

17:29:09 loadavg: 0.61 0.69 0.70 2/929 297043

PID    COMM             D MAJ MIN DISK       I/O  Kbytes  AVGms
297031 find             R 8   0   sda        139   596.0   6.87
18099  qemu-system-x86  W 8   0   sda         33   152.0   0.91
Detaching...
block layer static tracepoints
Block layer static tracepoints
can be listed with perf list block:* command, and they are defined in
include/trace/events/block.h.
Summary of available block layer tracepoints (2026-02-16):
| Tracepoint | Short description from kernel header file |
|---|---|
| block_bio_backmerge | Merging block operation to the end of an existing operation. |
| block_bio_complete | Completed all work on the block operation. |
| block_bio_frontmerge | Merging block operation to the beginning of an existing operation. |
| block_bio_queue | Putting new block IO operation in queue. |
| block_bio_remap | Map request for a logical device to the raw device. |
| block_dirty_buffer | Mark a buffer dirty. |
| block_getrq | Get a free request entry in queue for block IO operations. |
| block_io_done | Block IO operation request completed. |
| block_io_start | Insert a request for execution. |
| block_plug | Keep operations requests in request queue. |
| block_rq_complete | Block IO operation completed by device driver. |
| block_rq_error | Block IO operation error reported by device driver. |
| block_rq_insert | Insert block operation request into queue. |
| block_rq_issue | Issue pending block IO request operation to device driver. |
| block_rq_merge | Merge request with another one in the elevator. |
| block_rq_remap | Map request for a block operation request. |
| block_rq_requeue | Place block IO request back on a queue. |
| block_split | Split a single bio struct into two bio structs. |
| block_touch_buffer | Mark a buffer accessed. |
| block_unplug | Release of operations requests in request queue. |
| blkdev_zone_mgmt | Execute a zone management operation on a range of zones. |
| blk_zone_append_update_request_bio | Update bio sector after zone append. |
| blk_zone_wplug_bio | Zone write plugging plug and unplug events. |
| disk_zone_wplug_add_bio | Zone write plugging plug and unplug events. |
Interactive trace example: perf trace -a -e "block:*"
blktrace
blktrace tool is commonly tool for tracing block I/O. Under the hood, it uses the static tracepoints.
Try for example: blktrace /dev/sda -o - | blkparse -i - (or btrace /dev/sda
does the same thing).
Typical I/O flow, based on blktrace results: A→Q→G→P→U→I→D→C
Some documentation/presentations:
- blktrace and btt (2016-01-27)
- Block I/O Layer Tracing: blktrace (April 2006)
 Life of an I/O

  - Q2I – time it takes to process an I/O prior to it being inserted or merged onto a request queue
    - Includes split, and remap time
  - I2D – time the I/O is “idle” on the request queue
  - D2C – time the I/O is “active” in the driver and on the device
  - Q2I + I2D + D2C = Q2C

  - Q2C: Total processing time of the I/O
lsblk
lsblk gives information about block devices in system.
Example from server with HDD (sda) and SSD (sdb):
$ lsblk -O | less -RS

NAME            KNAME PATH                    MAJ:MIN FSAVAIL FSSIZE FSTYPE      FSUSED FSUSE% MOUNTPOINT LABEL UUID                                   PTUUID                               PTTYPE PARTTYPE                             PARTLABEL PARTUUID                             PARTFLAGS  RA RO RM HOTPLUG MODEL               SERIAL                             SIZE STATE   OWNER GROUP MODE       ALIGNMENT MIN-IO OPT-IO PHY-SEC LOG-SEC ROTA SCHED       RQ-SIZE TYPE DISC-ALN DISC-GRAN DISC-MAX DISC-ZERO WSAME WWN                                RAND PKNAME HCTL       TRAN SUBSYSTEMS      REV VENDOR   ZONED
sda             sda   /dev/sda                  8:0                                                                                                    9c33d1bd-084e-464d-81f4-0517f69208a3 gpt                                                                                                  128  0  0       0 Logical_Volume      600508e0000000.................. 930.4G running             brw-rw----         0   4096      0    4096     512    1 mq-deadline     256 disk        0        0B       0B         0   32M 0x600508e0000000..................    1        6:1:0:0    sas  block:scsi:pci 3000 LSI      none
└─sda1          sda1  /dev/sda1                 8:1                  xfs                                        71ea6c97-c56b-4a80-879e-055079eebc49   9c33d1bd-084e-464d-81f4-0517f69208a3 gpt    0fc63daf-8483-4772-8e79-3d69d8477de4           add598f9-131c-3248-ad91-798a73cfb0aa           128  0  0       0                                                      930.4G                     brw-rw----         0   4096      0    4096     512    1 mq-deadline     256 part        0        0B       0B         0   32M 0x600508e000000...................    1 sda                    block:scsi:pci               none
sdb             sdb   /dev/sdb                  8:16                                                                                                   e46f42f0-8e0a-484a-ba8d-bb77544a88de gpt                                                                                                  128  0  0       0 INTEL_SSDSC2BA200G4 BTHV5.............               186.3G running             brw-rw----         0   4096      0    4096     512    0 mq-deadline     256 disk        0        4K     128M         0    0B 0x55cd2e404c0f27b9                    0        6:0:0:0    sas  block:scsi:pci 0110 ATA      none
├─sdb1          sdb1  /dev/sdb1                 8:17                                                                                                   e46f42f0-8e0a-484a-ba8d-bb77544a88de gpt    21686148-6449-6e6f-744e-656564454649           1cedf85d-2f79-4141-b700-10ef59992ae9           128  0  0       0                                                          1M                     brw-rw----         0   4096      0    4096     512    0 mq-deadline     256 part        0        4K     128M         0    0B 0x55cd2e404c0f27b9                    0 sdb                    block:scsi:pci               none
├─sdb2          sdb2  /dev/sdb2                 8:18   702.1M 975.9M ext4        206.6M    21% /boot            095c08ca-b232-41a1-ac36-88e0857164c6   e46f42f0-8e0a-484a-ba8d-bb77544a88de gpt    0fc63daf-8483-4772-8e79-3d69d8477de4           31ae9573-8bae-4234-b0fe-4100eca282a6           128  0  0       0                                                          1G                     brw-rw----         0   4096      0    4096     512    0 mq-deadline     256 part        0        4K     128M         0    0B 0x55cd2e404c0f27b9                    0 sdb                    block:scsi:pci               none
└─sdb3          sdb3  /dev/sdb3                 8:19                 LVM2_member                                19yFEx-beW4-6czf-u3nG-bJdZ-Jruu-tV1JSg e46f42f0-8e0a-484a-ba8d-bb77544a88de gpt    e6d6d379-f507-44c2-a23c-238f2a3df928           1ed0b54d-c9cc-4d99-840c-bc3b278c287d           128  0  0       0                                                      185.3G                     brw-rw----         0   4096      0    4096     512    0 mq-deadline     256 part        0        4K     128M         0    0B 0x55cd2e404c0f27b9                    0 sdb                    block:scsi:pci               none
  └─fedora-root dm-0  /dev/mapper/fedora-root 253:0    177.4G 185.2G xfs           7.9G     4% /                29fbae26-8354-4e9a-ae30-37e4fc6c4a3e                                                                                                                                             128  0  0       0                                                      185.3G running             brw-rw----         0   4096      0    4096     512    0                 128 lvm         0        4K     128M         0    0B                                       0 sdb3                   block                        none
debugfs
Various block layer internal info/stats are available via debugfs, example:
# grep -R . /sys/kernel/debug/block/vdb/hctx0/
/sys/kernel/debug/block/vdb/hctx0/type:default
/sys/kernel/debug/block/vdb/hctx0/dispatch_busy:0
/sys/kernel/debug/block/vdb/hctx0/active:0
/sys/kernel/debug/block/vdb/hctx0/run:13644
/sys/kernel/debug/block/vdb/hctx0/queued:15855
/sys/kernel/debug/block/vdb/hctx0/dispatched:       0   5
/sys/kernel/debug/block/vdb/hctx0/dispatched:       1   16467
/sys/kernel/debug/block/vdb/hctx0/dispatched:       2   0
/sys/kernel/debug/block/vdb/hctx0/dispatched:       4   0
/sys/kernel/debug/block/vdb/hctx0/dispatched:       8   0
/sys/kernel/debug/block/vdb/hctx0/dispatched:      16   0
/sys/kernel/debug/block/vdb/hctx0/dispatched:      32+  0
/sys/kernel/debug/block/vdb/hctx0/io_poll:considered=0
/sys/kernel/debug/block/vdb/hctx0/io_poll:invoked=0
/sys/kernel/debug/block/vdb/hctx0/io_poll:success=0
[...]
FIO
FIO README:
Overview and history
--------------------

Fio was originally written to save me the hassle of writing special test case
programs when I wanted to test a specific workload, either for performance
reasons or to find/reproduce a bug. The process of writing such a test app can
be tiresome, especially if you have to do it often.  Hence I needed a tool that
would be able to simulate a given I/O workload without resorting to writing a
tailored test case again and again.

A test work load is difficult to define, though. There can be any number of
processes or threads involved, and they can each be using their own way of
generating I/O. You could have someone dirtying large amounts of memory in a
memory mapped file, or maybe several threads issuing reads using asynchronous
I/O. fio needed to be flexible enough to simulate both of these cases, and many
more.

Fio spawns a number of threads or processes doing a particular type of I/O
action as specified by the user. fio takes a number of global parameters, each
inherited by the thread unless otherwise parameters given to them overriding
that setting is given.  The typical use of fio is to write a job file matching
the I/O load one wants to simulate.
Writeback throttling
Short description of WBT found in kernel block/Kconfig
config BLK_WBT
	bool "Enable support for block device writeback throttling"
	help
	Enabling this option enables the block layer to throttle buffered
	background writeback from the VM, making it more smooth and having
	less impact on foreground operations. The throttling is done
	dynamically on an algorithm loosely based on CoDel, factoring in
	the realtime performance of the disk.

config BLK_WBT_MQ
	bool "Enable writeback throttling by default"
	default y
	depends on BLK_WBT
	help
	Enable writeback throttling by default for request-based block devices.
Tracepoints defined in include/trace/events/wbt.h
| Tracepoint | Short description |
|---|---|
| wbt_lat | Trace latency event. |
| wbt_stat | Trace stats for blk_wb. |
| wbt_step | Trace wb event step. |
| wbt_timer | Trace wb timer event. |
The end
That’s it!
To support my work and to motivate me: